CARE Super Pty Ltd (Trustee) ABN 91 006 670 060 AFSL 235226 RSE L0000956 CARE Super (Fund) ABN 98 172 275 725
Disclaimer: This Annual Report is issued by the Trustee of CARE Super, CARE Super Pty Ltd ABN 91 006 670 060, the holder of Australian Financial Services Licence 235226.
The information contained in this Annual Report is about CARE Super and is not intended as financial advice. It does not take into account specific needs, so members should look at their own personal position, objectives and requirements before taking any action. Past performance is not a reliable indicator of future performance and you should consider other factors before choosing a fund or changing your investments. The Trust Deed is the legal document governing your superannuation benefit. Other information about CARE Super: a copy of the Trust Deed, Investment Policy Statement, the Fund’s audited accounts are available upon request. You should also obtain and read the Product Disclosure Statement before making any investment decision. If you would like to see these documents, please go to caresuper.com.au or call the CareSuperLine on 1300 360 149.

Our returns
Superior returns (super)
Compare CareSuper’s Balanced (MySuper) option returns to 30 June 2017 and see how we’ve delivered strong performance year after year.
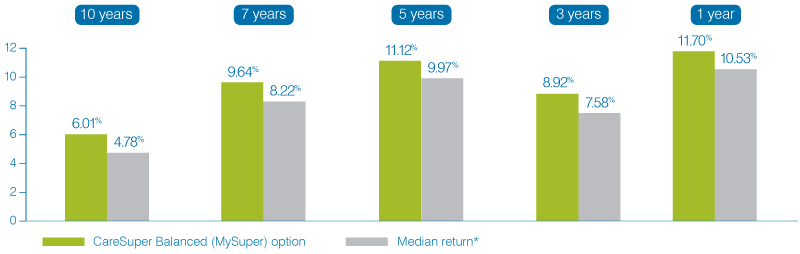
Please note: CareSuper’s 10-, 7-, 5- and 3-year returns are compound average annual returns. CareSuper returns are net of fees and taxes. Past performance is not a reliable indicator of future performance and you should consider other factors before choosing a fund or changing your investments. Returns have been rounded to two decimal places. * Source: SuperRatings Fund Crediting Rate Survey – SR50 Balanced (60–76) Index, June 2017. This survey includes Balanced options for industry funds and master trusts.
Superior returns (pension)
Compare CareSuper’s Balanced option returns to 30 June 2017 with other Balanced returns and see how we’ve delivered strong performance year after year.
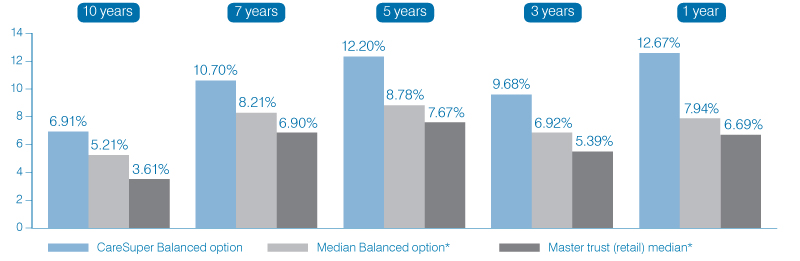
Please note: CareSuper’s 10-, 7- and 5-year returns are compound average annual returns. CareSuper returns are net of fees and taxes. Past performance is not a reliable indicator of future performance and you should consider other factors before choosing a fund or changing your investments. Returns have been rounded to two decimal places. * Source: SuperRatings Pension Fund Crediting Rate Survey – SRP50 Balanced (60–76) Index, June 2017. This survey includes Balanced options for industry funds and master trusts.