Our environment is constantly changing, and so are we.
We're moving online wherever we can to make things easy for you, and also to help reduce our impact on the environment. That's why this year we've decided not to print our Annual Report, but to create this website so you can access it whenever you want. We hope you find this information of interest and welcome your feedback.
At CareSuper, our mission and purpose inform everything we do,
and we act in line with our values at all times.
Our purpose
The purpose of superannuation is to deliver a better standard of living in retirement by providing a reliable and sustainable income stream. This income stream is the result of contributions and investment returns accumulated during a person’s working life. We focus on achieving strong net benefit results, complemented by relevant products and services, so members can enjoy a more comfortable lifestyle in retirement.
Our values
SPIRIT is the backbone of CareSuper. It is what CareSuper stands for. It defines what we do and how we behave. The staff jointly devised and defined the values as follows: service, professionalism, integrity, relationships, innovation and teamwork. At CareSuper, we are committed to delivering superior service and developing long-term relationships with our members and employers. We draw on our experience, integrity, teamwork and innovative approach to business when working with stakeholders to achieve common goals.
Our vision
To empower our members to achieve long-term financial security.
A top-rated fund
For more information on all of our awards, visit our website
Compare CareSuper’s Balanced (MySuper) option returns to 30 June 2014 with those of the median Balanced fund and master trust (retail) median and you’ll see that we’ve been consistently ahead of other super funds.

* Source: SuperRatings Fund Crediting Rate Survey – SR50 Balanced (60-76) Index, June 2014. This survey includes Balanced options for industry funds and master trusts.
Compare CareSuper’s Balanced option returns to 30 June 2014 with those of the median Balanced fund and master trust (retail) median and you’ll see that we’ve been consistently ahead of other funds.

* Source: SuperRatings Pension Fund Crediting Rate Survey – SRP50 Balanced (60-76) Index, June 2014. This survey included Balanced options for industry funds and master trusts.
** CareSuper did not provide a return to SuperRatings for this period.
CareSuper's total membership was over 255,000 at 30 June 2014
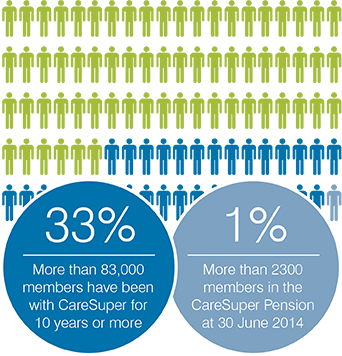
Member engagement

157,442 phone calls were received from members

Over 800,000 visits to the CareSuper website

Our client partnership team made more than 2000 workplace visits and 1100 one-on-one appointments

The financial planning team had more than 4000 total contacts with CareSuper members
with 828 attendees.
Seminars were held in 7 states and territories
throughout the country.
Employee Plan members
We are working hard to make super easy for you and increase the value of your membership.
Some of the changes to products and services throughout the year were:
This information is intended to assist members’ understanding of changes to CareSuper’s operations and the superannuation landscape within the last 12 months.
Super guarantee increase
The super guarantee (SG) was raised to 9.5% on 1 July 2014. It is currently scheduled to reach 12% in 2025.
MySuper
All members whose accounts were held only in CareSuper’s Balanced option prior to the implementation of MySuper (1 July 2013) are now considered to have a MySuper interest.
Insurance changes
In July 2014 we introduced a pre-existing condition exclusion on New Member Options and life events cover. These changes were brought about in an effort to ensure our premiums remain competitive, and to provide sustainable and equitable insurance options for existing members.
Low Income Super Contribution
In response to the Federal Government proposal to repeal the Low Income Super Contribution (LISC), CareSuper, in participation with other super funds and industry groups, campaigned to save the LISC via the ‘Keep super fair’ petition.
We are looking to the future to make sure we continue to provide the best products and services for members. Watch the video message from our Chair and CEO for more information on what the future holds for CareSuper. Some of the projects we are currently working on include:
Product additions
A self-managed super fund (SMSF) wind up service is now available for CareSuper members. We have partnered with specialist accounting firm Crowe Horwath to offer an SMSF wind up service that provides the expertise, guidance and knowledge required when closing an SMSF. This service is available exclusively to CareSuper members at a discounted rate. To find out more about this service, go to caresuper.com.au/smsfwindup.
New online resource
We understand the challenges many women face when it comes to the adequacy of their retirement savings. We have developed a website to provide women with tips, information and inspiration to help them take control of their finances and set themselves up for their retirement. Find out more at myfutureme.com.au
Enhancements to online services
MemberOnline, PensionOnline and Direct Investment Online are now suitable for viewing on mobile devices.
Enhancements to the Pension product
We have commenced a project to look at how we can best serve the needs of our current and future Pension members with our product offering.
The CareSuper Board is responsible for ensuring CareSuper is managed in the best interests of members.
The Board brings to the table specialist skills and experience to ensure your Fund is professionally managed. The CareSuper Board consists of equal numbers of Member and Employer representative Directors, and an Independent Director. Member and Employer Directors are nominated by relevant organisations in accordance with their particular nomination procedures and appointed by the Board. Decisions of the Board are made by at least a two-thirds majority.
The Trustee
The Trustee of CARE Super has an indemnity insurance policy in place to protect the Directors of the Trustee, and consequently the Fund, from the potential costs of legal action against them. The Trustee of CARE Super is CARE Super Pty Ltd ABN 91 006 670 060 and it is a holder of Australian Financial Services License number 235226. CARE Super Pty Ltd is a Registered Superannuation Entity Licensee, Licence number L0000956 and has received authority to offer a MySuper product, MySuper number 98172275725867.

Associated directorships
The following Directors held remunerated directorships during 2013/14 with organisations in which CareSuper invests/or engages services:
Sandy Grant Director Director, Industry Super Holdings Pty Ltd (holding company for IFM Holdings Pty Ltd) and Industry Fund Services Ltd.
Cate Wood Director Director, ISPT Pty Ltd, IGIPT Pty Ltd and Industry Super Australia Pty Ltd (non-remunerated).
The Board has established several committees to assist it to meet
its obligations and oversee certain operations of the Fund.
All Directors are required to serve on at least one and a maximum of two committees for which they receive an attendance fee. The Chair is a member of two committees and attends other committee meetings on an ex officio basis.
Compliance, Audit and Risk Management Committee
The purpose of the Compliance, Audit and Risk Management Committee (CARC) is to assist the Board in meeting its compliance and risk management responsibilities. The main activities of the Compliance, Audit and Risk Management Committee (CARC) in 2013/14 included:
- An internal audit as a result of the new prudential standards from 1 July 2013; appointed KPMG as internal auditor
- Ensuring compliance with the APRA Prudential Standards
- Collating data from various service providers to comply with enhanced reporting to APRA
- Various policy document reviews
- Ongoing monitoring of all risks within the Risk Management Framework.
Governance and Remuneration Committee
The key tasks for the Governance and Remuneration Committee (GRC) in 2013/14 were:
- Oversight of a Board assessment conducted by an external party
- Various policy document reviews
- Ongoing monitoring of the risks designated to the GRC
- Training for Directors – setting of the structure for the year based on skills matrix and competency assessment
- An APRA thematic review conducted on conflicts of interest.
Investment Review Committee
The primary function of the IRC is to monitor the implementation of the investment strategy and investment operations within the framework approved by the Board and as documented in the Investment Policy Statement. The Committee is responsible for the ongoing review of all external providers who manage the investments and investment operations of the Fund. A key priority for the IRC in 2013/14 was the review and reappointment of the Fund’s custodian.
Member and Employer Services Committee
The Member and Employer Services Committee (MESC) is responsible for oversight of:
- The Fund’s administration function, policies and services
- The Fund’s insurance management framework and strategy and the performance of outsourced providers
- All aspects of the Fund’s insurance policies and assessment of all relevant claims
- The Fund’s marketing, service, education, communications and product strategies
- The performance of providers of ancillary products
- Risk elements which may arise in relation to the relevant areas.
In 2013/14 some of the specific activities of the MESC included:
- Oversight of the employer, member and pension research projects conducted throughout the year
- Annual review of all member and employer interactions, including outbound activity, financial planning and the client partnership team, leading to implementation of a revised service model in these areas.
Directors received a fair base level remuneration for their responsibilities on the Board and were paid for meeting attendance, which varies based on Committee membership.
| Director | Fees paid to | Total | Super (where paid to an individual) | Board meetings attended8 | Committee meetings attended |
|---|---|---|---|---|---|
| Sue-Anne Burnley | SDA | $58,295.82 | 12/12 | 211 | |
| Sandy Grant | Director | $62,570.66 | $5787.79 | 12/12 | 92 |
| Gabriel Szondy | Director | $48,860.00 | $4519.55 | 9/12 | 4 |
| Barry Watchorn | Director | $52,439.96 | $4850.70 | 12/12 | 191 |
| Cate Wood | Director | $62,045.01 | $5739.16 | 12/12 | 82 |
| David Michaelis | Director | $57,614.98 | $5329.39 | 11/12 | 13 |
| Julie Bignell | ASU | $51,016.05 | 10/12 | 3 | |
| Garry Brack3 | AFEI | $35,385.36 | 5/10 | 3 | |
| Mark Sibree | Director | $50,059.96 | $4630.55 | 12/12 | 9 |
| Chris Christodoulou | Unions NSW | $52,693.37 | 11/12 | 7 | |
| Monica Clavijo | USU | $54,024.15 | 11/12 | 9 | |
| Keith Harvey4 | Director | $29,913.31 | $2766.98 | 7/7 | 4 |
| Katherine Sampson5 | Director | $9766.66 | $903.42 | 3/3 | 2 |
| John Burge6 | Director | $39,683.30 | $3670.71 | 7/9 | 3 |
| Michael Want7 | Director | $24,419.98 | $2258.85 | 6/6 | 5 |
2 The Chair attends additional meetings of other Committees on an ex officio basis.
3 Took a 3-month leave of absence from Nov 2013–Jan 2014.
4 Attended two additional Board meetings as part of induction process.
5 Commenced May 2014.
6 Retired April 2014.
7 Retired December 2013.
8 Includes 2-day strategy meeting.
CareSuper has a number of governance policies including, but not limited to, the Trust Deed, Board and Committee Charters, Constitution and Fund Governance Framework.
View these policies on our website.
Our corporate governance framework consists of a number of standards, policies and procedures, which detail the Trustee’s approach to managing the Fund. These policies include the Trust Deed, Board Charter and Constitution. The Trust Deed outlines the powers and responsibilities vested in the Trustee (CARE Super Pty Ltd) and the Constitution outlines how the Trustee will operate. This includes provisions for the appointment and removal of Directors and Independent Director(s). The Board Charter outlines the principle functions, policies and operations of the Board.
Risk Management Framework
As part of the overall governance of the Fund, CareSuper has developed a Risk Management Framework that covers risks across all operations. The framework is actively managed and reviewed by the Board and Committees. The material risks covered by this framework include investment governance, liquidity, insurance, fraud, operations, strategy and outsourcing. In addition, ongoing monitoring includes a risk radar to identify any potential future risks.
Related parties
CARE Super Pty Ltd is a shareholder of ISPT Pty Ltd and Industry Super Holdings Pty Ltd (ISH). ISH is the holding company for IFM Holdings Pty Ltd (IFM), Industry Super Australia Pty Ltd and Industry Fund Services Ltd. CARE Super Pty Ltd invests in products of ISPT, IGIPT Pty Ltd and IFM. All investments are made at arm’s length and on standard commercial terms, after appropriate due diligence, and carry the recommendation of our independent asset consultant. Industry Fund Services Ltd (IFS) has a number of subsidiaries including Industry Funds Investments Ltd, Super Members Investments Ltd and IFS Insurance Solutions Pty Ltd. CARE Super Pty Ltd engages the services of a number of these entities.
The CareSuper Board has appointed an executive group who manage the day-to-day operations of CareSuper.
Julie joined CareSuper in 2001 as General Manager – Trustee, Investment & Member Services and was appointed Chief Executive Officer in 2002. She is responsible for developing and implementing the Fund’s strategy and business plan to meet the needs of members, employers and other stakeholders, and for overall management of the Trustee’s operations through the executive team and staff.
Her experience in superannuation has been developed over 30 years with corporate superannuation funds, both defined benefit and accumulation, as well as with industry funds.
Julie holds a Bachelor of Business and has completed RG146 (Superannuation). She serves on the Policy Committee of AIST, the Executive of Industry Funds Forum, is a Fellow of the Australian Institute of Superannuation Trustees, a Member of the Australian Human Resources Institute and is a Director of the Fund Executives Association.
Greg joined CareSuper in 2006 as General Manager – Investments. Greg is responsible for advising on and implementing CareSuper’s investment strategy as determined by the Board. Greg is also responsible for managing the relationship with the Fund’s asset consultant and investment managers to ensure the philosophy and objectives of the Board’s strategy are satisfied.
Greg has spent his entire career in the financial sector, commencing in 1974 in money markets where he developed extensive experience as a trader and client relationship manager specialising in fixed interest assets.
Greg holds a Bachelor of Economics (Monash) and has successfully completed the Investment Management Consultants Assn (Aust) (IMCA) course for financial analysts.
Belinda joined CareSuper in January 2012 and is responsible for managing risk and finance, the compliance team and major projects for CareSuper. Belinda has over 18 years’ experience in superannuation including consulting, auditing and accounting.
Belinda started her career as an auditor at Ernst & Young before moving to Towers Watson where she held numerous roles including Senior Consultant for corporate super funds and Head of Research, Information and Compliance. Belinda holds a Bachelor of Business (Accounting & Information Systems) and is a Member of the Institute of Chartered Accountants in Australia.
Peter joined CareSuper in 2002 as General Manager – Marketing & Client Services. He is responsible for marketing strategy and execution, and for the delivery of member and employer services, including education, communications, business services and ancillary products.
His experience in the superannuation industry spans over 20 years across a variety of roles which include marketing, sales, relationship management, product development, sponsorship agreements and administration. Peter has experience in accumulation and defined benefit schemes, as well as corporate superannuation. Peter is a Fellow of the Association of Superannuation Funds of Australia (ASFA) and has completed RG146 (Superannuation).
Bernard joined CareSuper in 1998 with overall responsibility for member and employer administration services, development and implementation of insurance benefits and management of the relationships with the fund’s Administrator and Insurer.
He has over 30 years’ experience in the financial services sector, having worked in corporate superannuation funds, defined benefits and accumulation, as well as industry funds. Bernard has previously held several superannuation management positions. Prior to joining CareSuper he worked for a major insurance company as the Manager, Financial Services, where he managed a national superannuation fund. Bernard has completed RG146 (Superannuation) and other relevant superannuation courses.
At CareSuper we believe that the quality of decision making is enhanced by having a range of views represented at Board, Executive and staff levels. We consciously strive to achieve balance by seeking diversity across a number of factors including gender, age, experience, skills and professional qualifications.
Gender diversity
The Fund aims to achieve equal gender representation at Board level and, when seeking to fill Director vacancies, nominating organisations are asked to consider this, along with other criteria, when proposing candidates.
In recruitment of staff, selection will be made on merit, taking into account the skills, qualifications, experience and other attributes required to perform the role and contribute to the team.

The objectives of the Fund’s remuneration policy are to ensure that:
- CareSuper provides a fair, equitable and competitive remuneration framework that recognises and rewards individual contribution
- CareSuper attracts, retains and rewards its people appropriately
- CareSuper’s remuneration reflects the market in which the Fund competes for the capabilities required to achieve its business priorities and is consistent with its values and profit-to-members ethos.
Staff are remunerated by way of a fixed salary package. The Fund does not pay short- or long-term incentives, believing these are not aligned with its profit-to-members ethos. CareSuper’s target salary position is the 50th percentile (median) of the profit-to-members financial services sector (covering superannuation funds and credit unions). Annually, the CEO sources relevant market data from surveys to benchmark the salaries of each position within the Trustee Office. The annual salaries budget and total increases are approved by the Governance and Remuneration Committee.
CareSuper works with a range of independent experts to assist with the key operations of your super fund.
Service providers
CareSuper’s service providers during 2013/14 were:

Administration
Australian Administration Services Pty Ltd
Asset Consultant
JANA InvestmentAdvisers Pty Ltd

Auditor
CARE Super Pty Ltd
KPMG

Auditor
CARE Super
PricewaterhouseCoopers
Credit Control Services
Industry FundsCredit Control

Custodian
NAB Asset Servicing
Custodian
Pacific Custodians Pty Limited
Insurer
CommInsure
Insurance adviser
IFS Insurance Solutions
Legal Advisers
IFS Legal
Legal Advisers
Greenfields Financial Services Lawyers (Melbourne)
Legal Advisers
Hall & Wilcox Lawyers
Tax Adviser
KPMGCompliance
CARE Super is a regulated superannuation fund under the Superannuation Industry (Supervision) Act. The Trustee will lodge its annual return for 2014 as required by that Act and will continue to operate in accordance with all statutory requirements of superannuation, taxation and other relevant legislation.
Our investment adviser
JANA Investment Advisers Pty Ltd (JANA) was established in 1987 as a specialist investment adviser to large institutional investors such as CareSuper. JANA provides extensive research and recommendations on investment strategy and managers for the Fund. With JANA’s assistance, the Trustee monitors and reviews the performance of each investment manager.
Sustainable investing
Sustainable investing refers to the incorporation of non-financial risks, threats and opportunities into investment decision making and ownership practices. We believe it is imperative to invest funds under management responsibly, in a way that aligns with our overall risk management approach and focus on maximising retirement outcomes. As such, we integrate the consideration of environmental, social and governance (ESG) factors into our investment process in the belief that managing these risks will improve long-term returns to members.
We strongly encourage all of our investment managers to consider ESG factors when investing, and the Fund made the decision in February 2014 to ask our managers to exclude tobacco stocks from our portfolio, as we see holding these companies as a long-term risk.
CareSuper is a signatory to the Principles of Responsible Investing (PRI). The PRI is a voluntary international framework designed to help improve corporate performance on ESG issues. Each year CareSuper completes a PRI survey disclosing the efforts we have made towards implementing these six principles.
CareSuper is also a founding member of the Australian Council of Super Investors (ACSI) and ESG Research Australia, and a supporter of the Carbon Disclosure Project. CareSuper believes in being part of a collective voice and working with others within the investment industry to enhance our effectiveness in response to ESG issues. With regard to Australian Shares held by the Fund, our policy is to vote on all issues that companies in which we invest put to their shareholders at general or annual general meetings.
While CareSuper applies ESG principles across all asset classes that make up the investment options, thereby providing strong sustainability credentials, the Fund also offers a Sustainable Balanced option, which specifically invests in entities that are considered to have a sustainable future on environmental and/or social grounds.
Sustainability and members
We have been working hard to improve the way we communicate with you. As much as possible, we now try to keep you informed about your super via email. This minimises our printing requirements, which in turn reduces our impact on the environment.
Recently, we conducted research which revealed that over 90% of our members care about the environment and conservation, so we know these issues are important to you too. At CareSuper, you have a range of online, environmentally friendly options available to you, such as signing up for e-statements (see below) or updating your details via MemberOnline, rather than printing out a form.
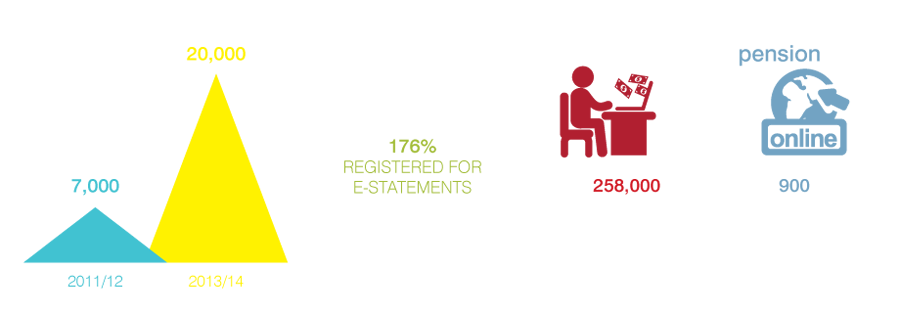
registered for MemberOnline
in 2013/14, bringing the total
number of members registered
to over 81,000!
How you can help
Almost 50,000 members were registered for e-statements as at 30 June 2014.
You can sign up too.
It’s easy, just log in to MemberOnline at caresuper.com.au/login or call the CareSuperLine on 1300 360 149.
At CareSuper, we feel strongly about incorporating environmentally friendly workplace practices into the day-to-day running of our office. Ongoing practices include, but are not limited to:
To ensure strong sustainability practices, CareSuper has a proactive staff sustainability committee. It is the committee’s role to raise awareness of sustainability issues within CareSuper’s offices and among members, suppliers and partners. In the past year, the committee has ensured sustainability is considered with regard to our products, services and other internal operations, and has introduced the following initiatives:
- A five-bin waste/recycling system that diverts more than 70% of office waste away from landfill
- New technologies, including the rollout of hybrid computers which enable client-facing staff to assist members and employers without the need for paper-based materials
- E-waste collection and recycling to ensure outdated technologies are disposed of in an eco-friendly manner
- Contribution to research around the sustainability expectations of CareSuper members.
CareSuper has delivered another year of strong results for our members, with the Balanced (MySuper) option delivering a return of 12.84% for the 2013/14 financial year. The Pension Balanced option has also performed well, returning 14.03% for the same period.
Direct Investment option updates
Enhancements to the Direct Investment option over the last year have provided our members with even more flexibility and choice:
- Three new term deposit providers have been added to the Direct Investment option, so members can now choose to invest in term deposits from four different banks
- In response to member feedback, CareSuper was one of the first industry super funds to offer listed investment companies (LICs) as an investment option
- Nine new ETFs (exchange-traded funds) added to offer members access to a wider range of markets and sectors
- Members can now choose to participate in certain types of corporate actions online, including off-market buybacks, rights issues, share purchase plans, mergers and takeovers.
Changes to the Capital Guaranteed option
CareSuper has changed the way the Capital Guaranteed option is managed, with the intention of providing members with more consistent returns. The Capital Guaranteed option is now invested more conservatively.
The Capital Guaranteed option still aims to ensure the security of members’ capital, and is still most suitable for members seeking to maintain the capital value of their investment. These changes became effective on 2 December 2013.
Direct Investment option updates
| Annual returns | Compound average annual returns | ||||||||
|---|---|---|---|---|---|---|---|---|---|
| Investment options | 2013/14 (%) | 2012/13 (%) | 2011/12 (%) | 2010/11 (%) | 2009/10 (%) | 10 years (% p.a.) | 7 years (% p.a.) | 5 years (%p.a.) | 3 years (%p.a.) |
| Managed options | |||||||||
| Capital Guaranteed | 1.67 | 0.90 | 2.35 | 3.30 | 2.70 | 3.90 | 3.06 | 2.18 | 1.64 |
| Capital Stable | 8.02 | 10.46 | 5.16 | 7.70 | 9.10 | 6.60 | 5.26 | 8.07 | 7.86 |
| Conservative Balanced | 9.80 | 12.92 | 4.05 | 8.50 | 9.30 | - | 5.13 | 8.88 | 8.86 |
| Balanced | 12.84 | 16.15 | 2.08 | 10.20 | 8.90 | 7.73 | 4.79 | 9.93 | 10.19 |
| Sustainable Balanced | 12.29 | 16.07 | 2.27 | 9.10 | 9.30 | 6.90 | 4.12 | 9.71 | 10.05 |
| Alternative Growth | 12.69 | 16.93 | 1.81 | 10.90 | 9.60 | - | 5.15 | 10.27 | 10.29 |
| Growth | 15.30 | 20.01 | -0.13 | 10.10 | 10.20 | 7.98 | 4.55 | 10.89 | 11.39 |
| Asset Class options | |||||||||
| Capital Secure | 2.83 | 3.39 | 4.20 | 4.90 | 4.00 | 4.21 | 3.82 | 3.86 | 3.47 |
| Fixed Interest | 4.93 | 6.04 | 11.37 | 7.00 | 11.00 | 6.49 | 7.11 | 8.03 | 7.41 |
| Direct Property | 8.60 | 5.89 | 7.36 | 8.60 | 4.30 | 6.91 | 4.31 | 6.94 | 7.28 |
| Australian Shares | 16.87 | 20.78 | -4.67 | 11.60 | 11.70 | 9.24 | 3.10 | 10.90 | 10.40 |
| Overseas Shares | 18.26 | 30.73 | -2.29 | 8.10 | 9.50 | 6.22 | 4.54 | 12.33 | 14.74 |
| CareSuper Pension annual returns | Compound average annual returns | |||||||
|---|---|---|---|---|---|---|---|---|
| Investment options | 2013/14 (%) | 2012/13 (%) | 2011/12 (%) | 2010/11 (%) | 2009/10 (%) | Since inception^ (%p.a.) | 5 years (%p.a.) | 3 years (%p.a.) |
| Managed options | ||||||||
| Capital Guaranteed | 1.84 | 0.95 | 2.39 | 3.30 | 2.86 | 3.12 | 2.25 | 1.72 |
| Capital Stable | 8.95 | 11.74 | 5.76 | 9.10 | 10.65 | 6.02 | 9.19 | 8.79 |
| Conservative Balanced | 10.92 | 14.97 | 4.48 | 10.00 | 10.86 | 5.93 | 10.18 | 10.04 |
| Balanced | 14.03 | 18.19 | 2.77 | 11.50 | 11.70 | 5.74 | 11.50 | 11.47 |
| Sustainable Balanced | 13.62 | 18.43 | 3.23 | 10.90 | 10.92 | 4.84 | 11.29 | 11.58 |
| Alternative Growth | 12.72 | 18.94 | 2.29 | 13.00 | 11.23 | 5.72 | 11.48 | 11.10 |
| Growth | 16.77 | 22.18 | 0.22 | 12.00 | 11.84 | 5.13 | 12.33 | 12.66 |
| Asset Class options | ||||||||
| Capital Secure | 3.24 | 4.15 | 5.07 | 5.70 | 4.81 | 4.53 | 4.57 | 4.15 |
| Fixed Interest | 5.84 | 6.93 | 12.74 | 8.10 | 12.91 | 8.18 | 9.24 | 8.46 |
| Direct Property | 9.62 | 7.02 | 8.37 | 9.70 | 5.23 | 4.91 | 7.95 | 8.33 |
| Australian Shares | 19.39 | 23.10 | -4.69 | 13.20 | 13.47 | 3.48 | 12.45 | 11.89 |
| Overseas Shares | 19.88 | 35.04 | -1.66 | 9.60 | 10.92 | 5.19 | 14.09 | 16.76 |
^ The inception date of the CareSuper Pension is 1 July 2007.
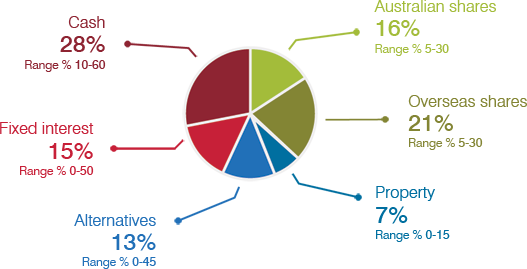
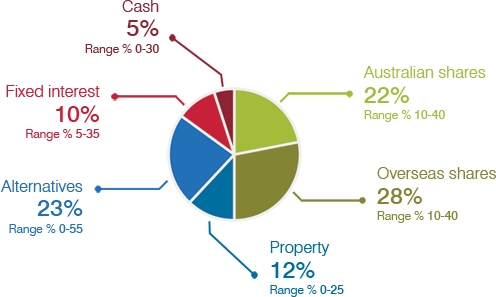
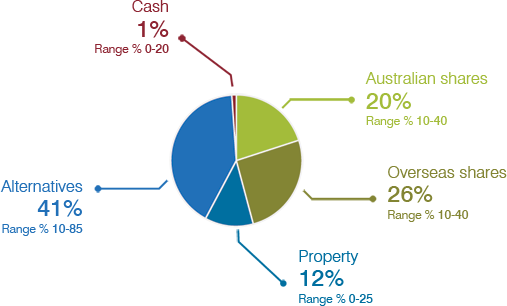
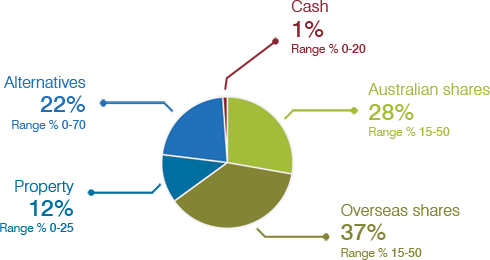
CareSuper has appointed professional investment managers to manage the assets of the fund. The performance of each investment manager is monitored closely by the Trustee. The table below lists the investment managers by asset class, the value of funds held by each and the percentage of total fund’s assets that each holding represents.
| CareSuper's investment managers during 2013/14 | Investments held by managers | |||
| 2014 | 2013 | |||
| $m | % of Fund | $m | % of Fund | |
| Fauchier Partners Absolute Return Trust2 | 0.00 | 0.00% | 64.09 | 0.83% |
| GAM Absolute Return Bond Fund1 | 76.59 | 0.85% | 0.00 | 0.00% |
| GMO Multi Strategy Trust1 | 154.92 | 1.71% | 0.00 | 0.00% |
| Schroder Real Return Fund2 | 0.00 | 0.00% | 33.64 | 0.43% |
| Wellington Global Total Return1 | 84.89 | 0.94% | 0.00 | 0.00% |
| Total | 316.40 | 3.50% | 97.73 | 1.26% |
| IFM Enhanced Index Equity Fund | 611.81 | 6.77% | 521.29 | 6.71% |
| Integrity Australian Equity | 149.80 | 1.66% | 129.10 | 1.66% |
| Paradice Investment Management Large Caps | 430.61 | 4.77% | 356.23 | 4.59% |
| Perennial Value | 386.34 | 4.28% | 321.16 | 4.14% |
| Renaissance Smaller Companies | 73.69 | 0.82% | 59.02 | 0.76% |
| Schroder Australian Equity Fund | 497.70 | 5.51% | 427.33 | 5.50% |
| Total | 2,149.95 | 23.80% | 1,814.13 | 23.37% |
| AMP Guaranteed Savings Account3 | 56.06 | 0.62% | 62.47 | 0.80% |
| Total | 56.06 | 0.62% | 62.47 | 0.80% |
| CFS Wholesale Premium Cash Fund2 | 0.00 | 0.00% | 413.24 | 5.32% |
| CFS Wholesale Cash Fund1 | 516.10 | 5.71% | 0.00 | 0.00% |
| Term Deposits4 | 319.86 | 3.54% | 358.55 | 4.62% |
| Total | 835.96 | 9.25% | 771.79 | 9.94% |
| Apollo Credit Fund | 129.05 | 1.43% | 124.36 | 1.60% |
| Gresham Property Fund No. 4 | 7.46 | 0.08% | 13.67 | 0.18% |
| HayFin Direct Lending1 | 23.91 | 0.26% | 0.00 | 0.00% |
| IFM Infrastructure Debt | 77.49 | 0.86% | 89.14 | 1.15% |
| Putnam Structured Credit | 204.63 | 2.27% | 188.81 | 2.43% |
| TGM Credit Overlay6 | 0.00 | 0.00% | 0.00 | 0.00% |
| Total | 442.54 | 4.90% | 415.97 | 5.36% |
| Charter Hall Core Plus Office Fund | 205.86 | 2.28% | 142.14 | 1.83% |
| DEXUS Wholesale Property Fund | 427.82 | 4.74% | 345.19 | 4.45% |
| Eureka Development Fund No. 2 | 0.20 | 0.00% | 0.32 | 0.00% |
| ISPT Core Fund | 275.25 | 3.05% | 251.82 | 3.24% |
| ISPT Development & Opportunities Fund No. 2 | 19.33 | 0.21% | 28.06 | 0.36% |
| ISPT Grosvenor International Property Trust7 | 0.59 | 0.01% | 0.90 | 0.01% |
| ISPT Retail Australia Property Trust | 42.53 | 0.47% | 32.22 | 0.42% |
| Lend Lease Australian Prime Property Fund Industrial2 | 0.00 | 0.00% | 12.17 | 0.16% |
| Lend Lease Australian Prime Property Fund Retail | 31.09 | 0.34% | 28.66 | 0.37% |
| Total | 1,002.68 | 11.10% | 841.49 | 10.84% |
| Franklin Templeton Global Aggregate Bond Fund | 89.66 | 0.99% | 81.95 | 1.06% |
| IFM Specialised Credit Fund6 | 114.66 | 1.27% | 105.18 | 1.35% |
| Legg Mason Brandywine Global Fixed Income Trust | 221.01 | 2.45% | 207.94 | 2.68% |
| ME Bank Super Loans Trust | 10.44 | 0.12% | 14.46 | 0.19% |
| Perennial Australian Fixed Interest | 205.54 | 2.28% | 192.39 | 2.48% |
| Schroder Fixed Income Fund | 197.80 | 2.19% | 186.50 | 2.40% |
| Total | 839.12 | 9.29% | 788.42 | 10.15% |
| AMP Capital Infrastructure Equity Fund | 61.91 | 0.69% | 56.09 | 0.72% |
| AMP Capital Strategic Infrastructure Trust Of Europe ($A) | 44.53 | 0.49% | 43.92 | 0.57% |
| Antin Infrastructure Fund | 25.51 | 0.28% | 23.55 | 0.30% |
| Hastings Utilities Trust Of Australia | 139.36 | 1.54% | 73.24 | 0.94% |
| IFM Australian Infrastructure Fund | 217.81 | 2.41% | 192.57 | 2.48% |
| IFM Renewable Energy (Convertible Notes) | 20.00 | 0.22% | 19.95 | 0.26% |
| Macquarie Global Infrastructure Fund II | 23.72 | 0.26% | 24.82 | 0.32% |
| TGM Infrastructure Overlay | 0.00 | 0.00% | 0.00 | 0.00% |
| Total | 532.85 | 5.90% | 434.15 | 5.59% |
| Baillie Gifford Long Term Global Growth | 194.67 | 2.15% | 146.05 | 1.88% |
| CFS Global Emerging Markets | 160.80 | 1.78% | 145.95 | 1.88% |
| MFS Global Equity Trust | 591.91 | 6.55% | 494.47 | 6.37% |
| Neuberger Berman Emerging Markets | 70.86 | 0.78% | 63.80 | 0.82% |
| Orbis Global Equity Fund | 257.06 | 2.85% | 209.74 | 2.70% |
| Pzena Global Value Fund | 161.66 | 1.79% | 131.15 | 1.69% |
| Schroder Global Dynamic Blend | 476.08 | 5.27% | 393.31 | 5.07% |
| Wellington Global Contrarian Equity | 227.63 | 2.52% | 185.60 | 2.39% |
| Zurich Global Thematic Share Fund | 182.54 | 2.02% | 156.37 | 2.01% |
| TGM Overseas Shares Overlay | 0.00 | 0.00% | 0.00 | 0.00% |
| Total | 2,323.21 | 25.72% | 1,926.44 | 24.81% |
| Advent Private Capital V | 6.32 | 0.07% | 6.53 | 0.08% |
| AMP Business Development Fund7 | 0.01 | 0.00% | 0.01 | 0.00% |
| Apax Europe VII2 | 0.00 | 0.00% | 10.43 | 0.13% |
| Archer Capital Fund 42 | 0.00 | 0.00% | 4.45 | 0.06% |
| Bain Capital Fund IX | 6.58 | 0.07% | 10.94 | 0.14% |
| Bain Capital Fund X | 9.95 | 0.11% | 10.00 | 0.13% |
| CHAMP Ventures 6A/6B2 | 0.00 | 0.00% | 7.03 | 0.09% |
| Coller International Partners V | 3.92 | 0.04% | 5.46 | 0.07% |
| Highland Credit Opportunities Fund | 6.72 | 0.07% | 6.15 | 0.08% |
| IFM Australian Private Equity Fund III | 4.68 | 0.05% | 5.17 | 0.07% |
| IFM Australian Private Equity Fund IV | 14.11 | 0.16% | 13.41 | 0.17% |
| IFM International Private Equity Fund I | 1.45 | 0.02% | 1.95 | 0.03% |
| IFM International Private Equity Fund II | 8.33 | 0.09% | 8.69 | 0.11% |
| IFM International Private Equity Fund III | 32.40 | 0.36% | 26.32 | 0.34% |
| Industry Super Holdings Pty Ltd | 9.74 | 0.11% | 9.28 | 0.12% |
| LGT Crown Europe Middle Market II | 31.59 | 0.35% | 26.92 | 0.35% |
| LGT Crown Global Secondaries II | 34.55 | 0.38% | 37.04 | 0.48% |
| Members Equity Bank Pty Ltd | 23.41 | 0.26% | 18.28 | 0.24% |
| OCM Opportunities Fund VII/VIIb2 | 0.00 | 0.00% | 2.86 | 0.04% |
| Partners Group Direct Investments 20121 | 32.01 | 0.35% | 0.00 | 0.00% |
| Partners Group Secondary 2008 | 25.32 | 0.28% | 28.66 | 0.37% |
| Partners Group Secondary 2011 | 64.76 | 0.72% | 28.52 | 0.37% |
| Siguler Guff Distressed Opportunities IV | 65.89 | 0.73% | 53.20 | 0.69% |
| Siguler Guff Small Buyout Opportunities Fund II1 | 29.41 | 0.33% | 0.00 | 0.00% |
| Stafford International Timberland VI | 13.81 | 0.15% | 13.29 | 0.17% |
| Warakirri International Hedge Equity Fund5 7 | 0.49 | 0.01% | 0.78 | 0.01% |
| Wilshire Private Markets | 30.12 | 0.33% | 32.15 | 0.41% |
| Wilshire Private Markets Asia No. 2 | 2.00 | 0.02% | 1.99 | 0.03% |
| TGM Private Equity Overlay | 0.00 | 0.00% | 0.00 | 0.00% |
| Total | 457.57 | 5.07% | 369.51 | 4.76% |
| AMP Capital Sustainable Share Fund | 20.84 | 0.23% | 18.09 | 0.23% |
| Total | 20.84 | 0.23% | 18.09 | 0.23% |
| Holowesko Global Fund2 | 0.00 | 0.00% | 151.38 | 1.95% |
| TGM Share Strategies Overlay2 | 0.00 | 0.00% | 0.00 | 0.00% |
| Total | 0.00 | 0.00% | 151.38 | 1.95% |
| Candriam Sustainable Global Equity Fund6 | 24.40 | 0.27% | 20.04 | 0.26% |
| TGM Sustainable Overseas Shares Overlay | 0.00 | 0.00% | 0.00 | 0.00% |
| Total | 24.40 | 0.27% | 20.04 | 0.26% |
| TGM Pension Balanced Overlay | 1.02 | 0.01% | 0.20 | 0.00% |
| TGM Pension Capital Stable Overlay | 0.44 | 0.00% | 0.10 | 0.00% |
| TGM Super Balanced Overlay | 26.85 | 0.30% | 51.01 | 0.66% |
| TGM Super Capital Stable Overlay | 0.82 | 0.01% | 0.20 | 0.00% |
| TGM Super Growth Overlay | 2.09 | 0.02% | 1.00 | 0.01% |
| TGM Super Sustainable Balanced Overlay | 0.29 | 0.00% | 0.10 | 0.00% |
| TGM Pension Conservative Balanced Overlay1 | 0.24 | 0.00% | 0.00 | 0.00% |
| TGM Super Conservative Balanced Overlay1 | 0.23 | 0.00% | 0.00 | 0.00% |
| Total | 31.97 | 0.35% | 52.61 | 0.68% |
| 9,033.56 | 100.00% | 7,764.23 | 100.00% |
2 Terminated during the year
3 During the year, this product changed from the AMP Capital Guaranteed Superannuation Policy, part of the AMP Life Statutory Fund No.1 (SF1) pool of assets, to the AMP Guaranteed Savings Account. Accumulation assets are invested in the AMP Guaranteed Savings Account (Superannuation) and Pension assets are invested in the AMP Guaranteed Savings Account (Pension).
4 Term Deposits held with Bank of Melbourne and BankWest and ME Bank.
5 Moved asset class during the year from the Share Strategies asset class (now discontinued) to the Private Equity asset class.
6 Name change during year.
7 Investment being wound down. Small residual balance remaining.
Figures exclude derivative positions. Percentages may not sum to totals shown due to rounding.
TGM is CareSuper's currency hedging and asset allocation (rebalancing) manager.
The top holdings of the Australian shares, overseas shares, direct property, cash, infrastructure and fixed interest asset classes are listed below.
| Holding | Asset Class | % of Fund |
| BHP Billiton Ltd | Australian Equities | 2.04% |
| Commonwealth Bank Of Australia | Australian Equities | 1.99% |
| Westpac Banking Corporation | Australian Equities | 1.71% |
| Australia And New Zealand Banking Group | Australian Equities | 1.62% |
| National Australia Bank | Australian Equities | 1.45% |
| Telstra Corporation Ltd | Australian Equities | 1.13% |
| Melbourne Airport | Infrastructure | 0.97% |
| Woolworths Ltd | Australian Equities | 0.82% |
| Woodside Petroleum Ltd | Australian Equities | 0.70% |
| Wesfarmers Ltd | Australian Equities | 0.69% |
| Percentage of Fund holdings | 13.12% |
| Security | % of asset class | % of Balanced (MySuper) option |
| BHP Billiton Ltd | 8.77% | 1.84% |
| Commonwealth Bank Of Australia | 8.51% | 1.79% |
| Westpac Banking Corporation | 7.35% | 1.54% |
| Australia And New Zealand Banking Group | 6.95% | 1.46% |
| National Australia Bank | 6.25% | 1.31% |
| Telstra Corporation Ltd | 4.84% | 1.02% |
| Woolworths Ltd | 3.57% | 0.75% |
| Woodside Petroleum Ltd | 3.00% | 0.63% |
| Wesfarmers Ltd | 2.98% | 0.63% |
| Macquarie Group Ltd | 2.24% | 0.47% |
| Rio Tinto Ltd | 2.17% | 0.46% |
| Brambles Ltd | 2.04% | 0.43% |
| Origin Energy Ltd | 1.79% | 0.38% |
| CSL Ltd | 1.73% | 0.36% |
| AMP Ltd | 1.54% | 0.32% |
| QBE Insurance Group Ltd | 1.42% | 0.30% |
| Transurban Group | 1.35% | 0.28% |
| Amcor Ltd | 1.03% | 0.22% |
| Orica Ltd | 0.97% | 0.20% |
| Westfield Corporation | 0.96% | 0.20% |
| Total of asset class | 69.46% | 14.59% |
Percentages may not sum to totals shown due to rounding. The figures are subject to change or revision at any time and CareSuper accepts no responsibility for omissions or errors. For more information on CareSuper’s investment managers go to caresuper.com.au/investmentmanagers.
| Security | % of asset class | % of Balanced (MySuper) option |
| Amazon.com Inc | 0.86% | 0.22% |
| Tencent Holdings Ltd | 0.85% | 0.22% |
| Oracle Corp | 0.85% | 0.22% |
| Baidu Inc (ADR) | 0.81% | 0.21% |
| Linde AG | 0.80% | 0.21% |
| Samsung Electronics Co Ltd | 0.79% | 0.20% |
| Reckitt Benckiser Group PLC | 0.79% | 0.20% |
| Walt Disney Co | 0.78% | 0.20% |
| Honeywell International Inc | 0.73% | 0.19% |
| Nestle SA | 0.70% | 0.18% |
| American International Group | 0.68% | 0.18% |
| Google Inc | 0.67% | 0.17% |
| Accenture PLC | 0.64% | 0.17% |
| Schneider Electric SA | 0.64% | 0.17% |
| Microsoft Corp | 0.61% | 0.16% |
| Diageo PLC | 0.59% | 0.15% |
| Illumina Inc | 0.59% | 0.15% |
| Visa Inc | 0.59% | 0.15% |
| Bayer AG | 0.59% | 0.15% |
| 3M Co | 0.58% | 0.15% |
| Total of asset class | 14.12% | 3.67% |
Percentages may not sum to totals shown due to rounding. The figures are subject to change or revision at any time and CareSuper accepts no responsibility for omissions or errors. For more information on CareSuper’s investment managers go to caresuper.com.au/investmentmanagers.
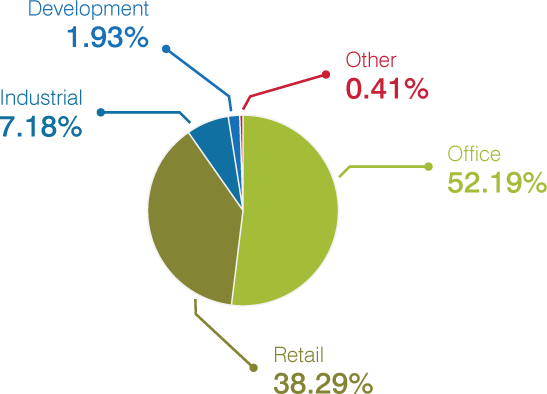
| Property | Sector | State | % of asset class | % of Balanced (MySuper) option |
| Gateway, 1 Macquarie Place, Sydney | Office | NSW | 6.83% | 0.82% |
| Westfield Miranda, Sydney | Retail | NSW | 6.79% | 0.81% |
| Westfield Hurstville, Sydney | Retail | NSW | 2.34% | 0.28% |
| Willows and adjacent properties, Townsville | Retail | QLD | 2.18% | 0.26% |
| 1 Bligh St, Sydney | Office | NSW | 2.17% | 0.26% |
| Westfield North Lakes, Brisbane | Retail | QLD | 2.11% | 0.25% |
| Westfield West Lakes, Adelaide | Retail | SA | 2.09% | 0.25% |
| 570 Bourke Street, Melbourne | Office | VIC | 2.03% | 0.24% |
| Westfield Mt Druitt, Sydney | Retail | NSW | 2.03% | 0.24% |
| 11 Exhibition Street, Melbourne | Office | VIC | 2.03% | 0.24% |
| 452 Flinders Street, Melbourne | Office | VIC | 1.96% | 0.23% |
| 275 George Street, Brisbane | Office | QLD | 1.94% | 0.23% |
| 360 Collins St, Melbourne | Office | VIC | 1.91% | 0.23% |
| 225 St Georges Terrace, Perth | Office | WA | 1.91% | 0.23% |
| 9 Castlereagh Street, Sydney | Office | NSW | 1.85% | 0.22% |
| Northbank Plaza, Brisbane | Office | QLD | 1.70% | 0.20% |
| BankWest Place, Perth | Office | WA | 1.63% | 0.20% |
| AM60, 60 Albert Street, Brisbane | Office | QLD | 1.43% | 0.17% |
| Brisbane Square, Brisbane | Office | QLD | 1.41% | 0.17% |
| Westfield Doncaster Shopping Centre, 619 Doncaster Road, Doncaster | Retail | VIC | 1.41% | 0.17% |
| Total of asset class | 47.76% | 5.73% |
Percentages may not sum to totals shown due to rounding. The figures are subject to change or revision at any time and CareSuper accepts no responsibility for omissions or errors. For more information on CareSuper’s investment managers go to caresuper.com.au/investmentmanagers.
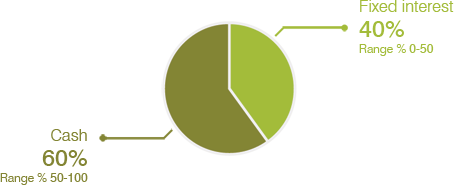
CareSuper's Cash asset class invests in two sub-asset classes: Cash and Term Deposits. Cash is managed by Colonial First State and invests in a range of securities deemed as cash, including term deposits and discount securities. Term Deposits are managed internally by CareSuper. Benchmark exposures to sub-asset classes within the Cash asset class can be found below.
| Cash instrument | Cash (sub-asset class) | Term deposits (sub-asset class) |
| Term Deposits | 19.13% | 100.00% |
| Negotiable Certificates of Deposits | 67.36% | |
| Floating Rate Notes | 10.77% | |
| Deposit Accounts | 2.72% | |
| Cash | 0.02% | |
| Total | 100.00% | 100.00% |
| Maturity profile | Cash | Term deposits |
| 0 - 30 days | 26.29% | 8.39% |
| 31 - 90 days | 47.62% | 20.09% |
| 91 - 180 days | 26.09% | 41.13% |
| 181 - 365 days | 0.00% | 30.40% |
| Total | 100.00% | 100.00% |
| Option | Cash sub-asset class benchmark % | Term deposit sub-asset class benchmark % | Total cash asset class benchmark % |
| Capital Stable | 13% | 25% | 38% |
| Conservative Balanced | 8% | 20% | 28% |
| Balanced | 3% | 2% | 5% |
| Sustainable Balanced | 3% | 2% | 5% |
| Capital Secure | 50% | 50% | 100% |
| Fixed Interest | 2% | 33% | 35% |
Percentages may not sum to totals shown due to rounding. The figures are subject to change or revision at any time and CareSuper accepts no responsibility for omissions or errors. For more information on CareSuper’s investment managers go to caresuper.com.au/investmentmanagers.
| Infrastructure asset | % of asset class | % of Balanced (MySuper) option |
| Melbourne Airport | 16.53% | 1.16% |
| Perth Airport | 9.68% | 0.68% |
| Pacific Hydro | 7.61% | 0.53% |
| Port of Brisbane | 6.67% | 0.47% |
| NSW Ports | 6.66% | 0.47% |
| Brisbane Airport | 3.92% | 0.27% |
| Interlink Roads (M5) | 3.82% | 0.27% |
| Renewable Energy Convertible Note | 3.75% | 0.26% |
| Newcastle Airport | 3.00% | 0.21% |
| South East Water | 2.61% | 0.18% |
| DCT Gdansk | 2.46% | 0.17% |
| Powerco NZ | 2.34% | 0.16% |
| Freeport LNG | 2.32% | 0.16% |
| NT Airports | 2.23% | 0.16% |
| Phoenix Natural Gas | 2.21% | 0.15% |
| Thames Water | 2.10% | 0.15% |
| Sydney Desalination Plant | 1.84% | 0.13% |
| Southern Cross Station | 1.51% | 0.11% |
| ElectraNet | 1.38% | 0.10% |
| CLH | 1.32% | 0.09% |
| Total of asset class | 83.98% | 5.88% |
Percentages may not sum to totals shown due to rounding. The figures are subject to change or revision at any time and CareSuper accepts no responsibility for omissions or errors. For more information on CareSuper’s investment managers go to caresuper.com.au/investmentmanagers.
| Country | % of asset class |
| Australia | 65.68% |
| United States | 9.12% |
| Mexico | 3.37% |
| Italy | 2.98% |
| United Kingdom | 2.47% |
| Poland | 1.63% |
| Germany | 1.63% |
| South Korea | 1.62% |
| Supranational | 1.61% |
| Others | 1.26% |
| Brazil | 1.16% |
| South Africa | 1.04% |
| Holdings under 1% | 6.45% |
| Total | 100.00% |
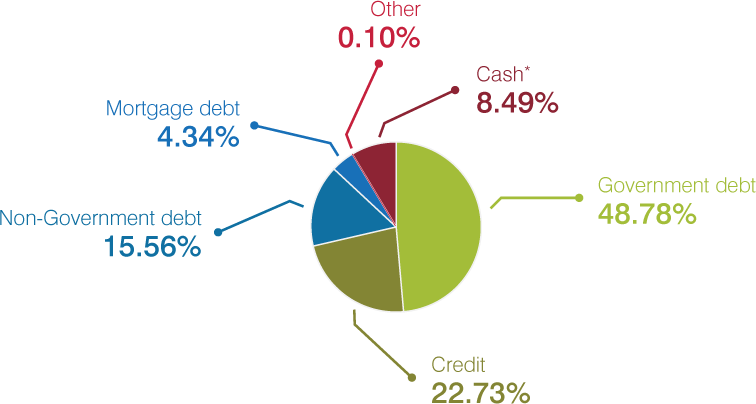
These holdings are based on the aggregate positions of CareSuper’s investment managers.
Percentages may not sum to totals shown due to rounding. The figures are subject to change or revision at any time and CareSuper accepts no responsibility for omissions or errors. For more information on CareSuper’s investment managers go to caresuper.com.au/investmentmanagers.
CareSuper’s Investment Policy
It is the responsibility of the Board to develop the investment policy and ensure the Trustee adheres to its principles, philosophy and guidelines.
There are several sub-policies covering the investment governance framework, investment fees, currency, proxy voting and asset valuation. Each of these policies is reviewed on a regular basis.
CareSuper’s assets are managed according to the investment strategy for each investment option that has stated asset allocation benchmarks or, in the case of the Managed options, an asset allocation range. The Trustee has developed an investment strategy after taking into consideration the Fund’s overall circumstances, reviewing membership demographics, current market conditions and all applicable legislation.
The Trustee has given consideration to the following investment objectives in establishing an investment strategy:
- Produce real capital growth and income over time
- Manage investments with a defensive strategy
- Produce less volatile returns relative to peers
- Provide competitive returns
- Provide commensurate return for risk
- Manage liquidity
- Responsible investing, including the consideration of environmental, social and corporate governance issues
- Tax-effectiveness, and
- Costs.
The Trustee’s philosophy is to actively manage investments for the long term with an aim of producing competitive returns while minimising risk when markets are volatile.
The Trustee selects and appoints professional investment managers to invest members’ assets consistent with the investment options.
Within most asset classes, the Trustee has diversified the management of investments between several investment managers (and varying investment styles) with the aim of moderating the volatility in the overall return of the asset class. The Trustee does not manage any investments internally, with the exception of term deposits and the cash flow required for day-to-day operations. Licensed investment consultants advise on all investment matters including the selection of investment managers whose investment objectives must be consistent with those of the Fund.
Constraints applied to the managers are consistent with the objectives and philosophy of the Trustee.
Managing benchmark risk
Benchmark risk is the potential for the returns of an option to differ significantly from the returns of the benchmark against which it is measured. As the value of assets in each option will vary depending on market conditions, asset allocation may vary from the benchmark.
Managing currency risk
As a matter of policy, the Trustee seeks to eliminate currency risk in international investments, except overseas shares, where exposure to currency movements is held within a pre-set range. The Trustee reserves the right to alter the Fund’s currency exposure if this is considered in the interests of CareSuper members.
Rebalancing
The asset allocation of each Managed option is reviewed weekly and rebalanced when outside predetermined tolerance limits. Asset allocation(s) will remain within the specified range(s).
Use of derivatives
Investment managers may use futures, options and other derivative instruments to enhance returns or manage risk. However, these instruments may not be used to leverage the portfolio or to cause the overall exposure to any asset class or combination of classes to breach the long-term strategic ranges. Each year the Trustee seeks a statement from each investment manager on the use of derivatives within its portfolio.
Voting
Voting is a tool that shareholders, as owners of a company, can use to exert influence or send a signal to the board of a company. CareSuper considers voting best practice and exercises its voting rights on behalf of members in the Australian Equities portfolio. View CareSuper’s voting history
Overview of voting actions in 2013/14

Investments exceeding 5% of assets
At 30 June 2014 the following investment houses managed more than 5% of the Fund’s assets: Schroder Investment Management Australia 13.0%; IFM Investors 12.2%; Colonial First State 7.5%; MFS Investment Management 6.6%; Perennial Investment Management 6.6%.
Unit pricing
CareSuper uses unit prices to calculate and report members’ superannuation balances and apply investment returns. Every CareSuper member’s account balance information includes the number of units they own, as well as the latest sell price. Each investment option has two prices: a buy price and a sell price. A buy price is the price applied when you invest in an investment option. For example, when your employer makes a contribution to your account you will be allocated units at the buy price. A sell price is the price applied when money is withdrawn from an investment option, including withdrawals from your account for investment switches and payments, direct fees, insurance premiums and tax deducted directly from your account. The sell price is used to calculate your account balance. To find out additional details about buy–sell spreads and how unit prices are calculated, please see the Member Guide PDS and Investment Guide available at caresuper.com.au/PDS.
Managing unit pricing errors
In the event of a unit pricing error deemed material in nature, CareSuper aims to correct the financial position of current and former members by an amount that would bring their account balance to a position as if no error had occurred. In estimating an amount of compensation CareSuper will, where practical, use actual values. If these are not available estimates will be used.
Investment strategy – reserves
CareSuper maintains a series of reserves designed to provide for known and potential commitments and contingencies. The Fund maintains three reserve accounts as follows:
- General reserve
- Group life reserve, and
- Operational risk reserve
The reserves are considered to be the Fund’s ‘capital’ and each account is invested in a strategy appropriate to the time frame and risk profile of that account reviewed annually by the Board. Each strategy is invested in existing asset classes held by the Fund and are maintained by the Fund’s custodian.
| CareSuper’s reserves over the last 3 years: | % of fund net assets | |
| 2013/14 | $76,510,177 | 0.85% |
| 2012/13* |
$70,228,001 | 0.91% |
| 2011/12 | $47,238,248 | 0.97% |
CareSuper is committed to charging fees only to cover costs, as we aim to maximise members' retirement savings.
We also believe in ensuring our fees are transparent and easy to understand. It is our policy to include underlying investment costs in fees disclosed to members, and we have always done so.
Understanding fees and costs
Indirect investment costs cover the cost of investing the Fund’s assets and include base and performance fees paid to investment managers, asset consultant fees, bank fees and custody costs. Performance fees may be paid to an investment manager whose fee is linked to performance and are paid when the manager’s portfolio performs above an agreed benchmark. CareSuper has a number of managers whose fee is aligned to their performance, predominantly in the Australian shares, overseas shares and alternative asset classes. Where a performance fee is paid, a lower base fee applies.
These fees, known as the indirect cost ratio (ICR), are not taken directly from members' accounts, but deducted from investment earnings over the year and are reflected in the calculation of unit prices. These investment expenses change from time to time because of changes in managers, performance and/or other fees. Revisions to the ICR for an investment option will be available at caresuper.com.au.
Contributions tax
Contributions tax is deducted from employer and salary sacrifice contributions after the deduction of the administration fee and insurance premiums.
Estimated annual investment cost or Indirect Cost Ratio (ICR)
Investment costs are an ongoing focus for CareSuper and we are pleased to report a reduction in the ICRs from last year.
CareSuper has always sought to demonstrate best practice and transparency around disclosure of all costs, including those relating to investments. A significant component of the ICR relates to those manager costs which are incurred when a fund manager appointed by CareSuper in turn invests in a number of investment managers (referred to as fund of funds). This is an additional layer of costs that may not be disclosed by some super funds and is why CareSuper’s ICR may appear higher than other funds. CareSuper considers full disclosure of these costs as best practice and expects that more funds report these fund of funds costs in the future.
The ICR varies according to the chosen investment option. These costs are not deducted directly from your account but deducted over the year from unit prices. Performance costs are deducted from unit prices as relevant investment manager performance objectives are met.
View these costs for 2013/14 in the investment options section.
In 2013/14 these underlying manager costs accounted for 0.15% of the super Balanced option’s ICR. This predominantly relates to the private equity asset class which, after all costs, outperformed Australian and overseas shares with lower volatility over the long term.
Find out more
For information on the fees and costs associated with your CareSuper account, see Fees and other costs at caresuper.com.au/PDS.
The net benefit of a CareSuper account
It’s difficult to calculate the long-term effect of both returns and fees on your super savings. The graph below demonstrates the difference CareSuper’s combination of consistent long-term returns and competitive fees can make on a balance of $50,000 over 10 years.
The CareSuper Balanced option delivered over $27,000 more than the average retail super fund over the past 10 years.
Net benefit over 1, 5 and 10 years as at 30 June 2014
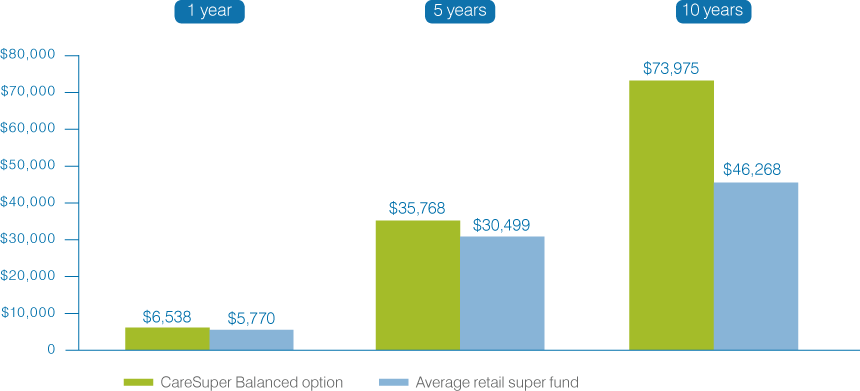
Comparisons modelled by SuperRatings, commissioned by ISA Pty Ltd ABN 72 158 563 270 Corporate Authorised Representative No. 426006 of Industry Fund Services Ltd ABN 54 007 016 195 AFSL 232514. Modelled outcome assumes a starting balance of $50,000 and initial salary of $50,000 and shows 10 year average difference in net benefit of the main balanced options of CareSuper’s Balanced option and 79 retail funds tracked by SuperRatings, with a 10 year performance history, taking into account historical earnings and fees – excluding contribution, entry, exit and additional advisor fees – of main balanced options. Outcomes vary between individual funds. Modelling as at 30 June 2014. Consider CareSuper’s Product Disclosure Statement (PDS) and your personal financial situation, needs or objectives, which are not accounted for in this information, before making an investment decision
In order to maintain a healthy Fund, CareSuper’s Trustees keep a close watch on investment performance and spending. The result is a financially fit Fund.
This financial summary is based on unaudited accounts and shows CareSuper’s main financial transactions for the year ended 30 June 2014 and corresponding final audited figures to 30 June 2013.
Statement of financial position as at 30 June 2014
| 2014 $'000 |
2013 $'000 |
| Cash and Cash Equivalents | ||
| Cash at Bank | 58,027 | 73,415 |
| Cash & Short Term Deposits | 879,772 | 838,832 |
| Trade and Other Receivables | ||
| Contributions Receivable | 17,697 | 20,447 |
| Investments | ||
| Financial Assets | ||
| Capital Guaranteed | 56,065 | 62,473 |
| Australian Shares | 2,197,429 | 1,855,528 |
| Overseas Shares | 2,347,608 | 1,946,488 |
| Alternatives | 1,749,354 | 1,468,737 |
| Fixed Interest | 839,121 | 788,421 |
| Property | 1,002,678 | 841,490 |
| Derivatives | 1,210,754 | 1,328,309 |
| Other Assets | ||
| Fixed Assets | 1,224 | 1,763 |
| Sundry Debtors | 5 | 919 |
| Capitalised Expenses | 2,300 | 2,873 |
| Tax Assets | ||
| Deferred Tax Assets | 1,332 | 14,310 |
| Total Assets | 10,363,366 | 9,244,005 |
| Trade and Other Payables | ||
| Group Life Insurance Premium Payable | 6,478 | 4,667 |
| Provision for Employee Benefits | 985 | 1,030 |
| Benefits Payable | 15,387 | 26,529 |
| Accounts Payable | 2,653 | 3,648 |
| Sundry Creditors | 11 | 14 |
| GST Payable | 979 | 98 |
| Investments - Financial Liabilities | ||
| Derivative Liabilities | 1,188,022 | 1,412,066 |
| Tax Liabilities | ||
| Current Tax Liabilities | 14,088 | 19,834 |
| Deferred Tax Liabilities | 99,147 | 31,811 |
| Total Liabilities | 1,327,750 | 1,499,697 |
| Net assets available to pay benefits | 9,035,616 | 7,744,308 |
| Represented by: |
| Allocated to members' accounts | 8,959,106 | 7,673,980 |
| Reserves | 76,510 | 70,228 |
| Regulatory Reserve | - | 100 |
| 9,035,616 | 7,744,308 |
Operating statement for the year ended 30 June 2014
| Revenue | 2014 $'000 |
2013 $'000 |
| Investment Revenue | ||
| Interest | 35,827 | 33,475 |
| Distributions | 425,153 | 241,000 |
| Other Investment Income | 11,190 | 7,520 |
| Changes in Net Market Value | 600,951 | 758,030 |
| 1,073,121 | 1,040,025 | |
| Contributions Revenue | ||
| Employer Contributions | 574,254 | 485,399 |
| Member Contributions | 126,154 | 78,241 |
| Transfers In | 349,049 | 1,944,267 |
| 1,049,457 | 2,507,907 | |
| Other Revenue | ||
| Proceeds from Group Life Policies | 46,364 | 50,798 |
| Other Income | 436 | 239 |
| Total Revenue | 2,169,378 | 3,598,969 |
| Expenses | 2014 $'000 |
2013 $'000 |
| Investment Expenses | ||
| Direct Investment Expenses | 15,395 | 12,089 |
| Group Life Insurance Expenses | 75,243 | 54,238 |
| General Administration Expenses | ||
| Administrator Expenses | 11,927 | 10,810 |
| Auditor's Remuneration | 273 | 152 |
| Operating Expenses | 21,564 | 32,420 |
| Regulatory Levies | 991 | 3,726 |
| Anti-Detriment Payments | 934 | 767 |
| Superannuation Contribution Surcharge | 17 | (27) |
| Total Expenses | 126,344 | 114,175 |
| Benefits Accrued | 2014 $'000 |
2013 $'000 |
| Benefits Accrued Before Income Tax | 2,043,034 | 3,484,794 |
| Income Tax Expense/(benefit) | 153,144 | 115,488 |
| Benefits Accrued After Income Tax | 1,889,890 | 3,369,306 |
Getting help
Enquiries and complaints
The Trustee has established procedures to deal fairly with enquiries and complaints from members, employers and beneficiaries.
Complaints can be received in a variety of ways – by telephone, email or letter. If you make an enquiry or complaint by telephone we will endeavour to answer it immediately. In some cases we may ask you to submit your complaint in writing so it can be investigated further and we will provide you with a written response.
The procedures to follow, time limits and other details are included in Making enquiries and complaints available at caresuper.com.au/PDS.
All complaints will be handled in a courteous and confidential manner.
Low account balance policy
The accounts of members who are uncontactable or inactive and with a balance of less than $200 will be transferred to the ATO in April and October each year.
Members who are uncontactable or inactive with an account balance of between $200 and $2000 will be transferred to the eligible rollover fund in June and December each year and any insurance cover will cease.
Contact details for CareSuper’s eligible
rollover fund are:
AUSfund
PO Box 543
Carlton South VIC 3053
|
Phone: Fax: International Tel: International Fax: Email: Website: |
1300 361 798 1300 366 233 +61 3 9814 6400 +61 8 8205 4990 admin@ausfund.net.au unclaimedsuper.com.au |
Temporary residents’ benefits transferred
to the ATO
CareSuper is required to pay the super of former temporary residents to the ATO if it has been more than 6 months since the former temporary resident employee departed Australia and their visa has expired or been cancelled. Visit ato.gov.au for more information.
The Trustee relies on relief from ASIC in that we are not obliged to notify or give an exit statement to a non-resident in the above circumstances. Information is available on request.
For more information about your super, you can reach us in the following ways:
|
Call Visit Write |
CareSuperLine 1300 360 149 Monday to Friday 8am to 8pm AEST caresuper.com.au admin@caresuper.com.au CareSuper Locked Bag 5087 Parramatta NSW 2124 |
Pension members:
|
Call Visit Write |
CareSuper PensionLine 1300 664 781 Monday to Friday 8am to 6pm AEST caresuper.com.au/retirement pension@caresuper.com.au CareSuper Locked Bag 5042 Parramatta NSW 2124 |
Keep your details up to date
If you have changed any of your personal details, such as your name, address or any of your contact numbers, or if you are about to, then don’t forget to let us know. Call us or log in to your account online at caresuper.com.au/login to advise your new details. Remember, if we can’t contact you, you may lose track of your super savings.
